
Hey guys,
I have a problem here where the render nodes set their processor affinity to 1 thread after an unknown amount of time.
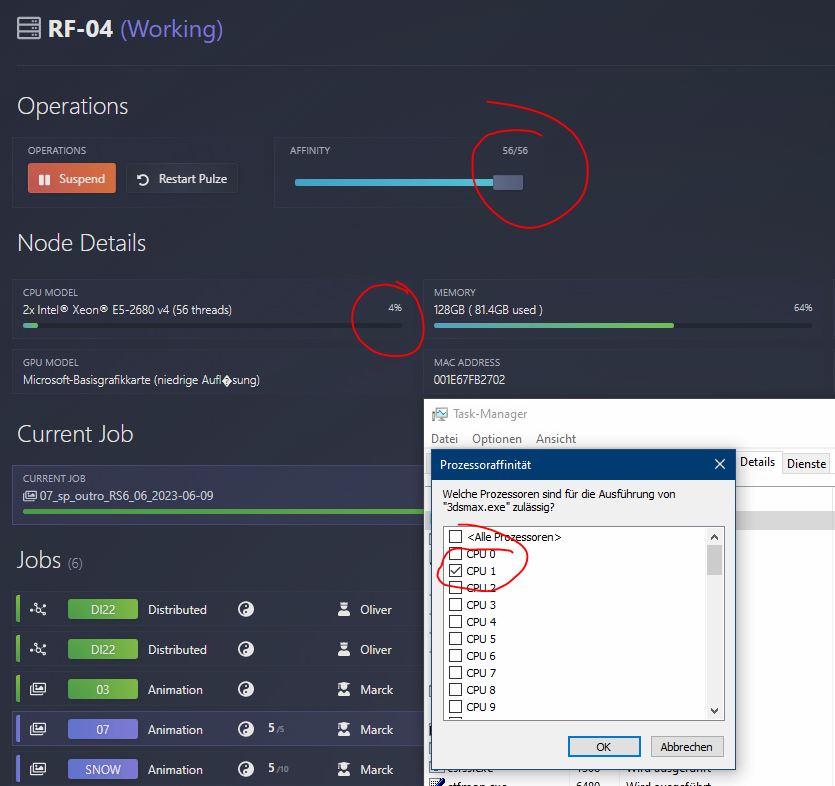
It happens like this: An animation is sent to the farm consisting of 10 nodes. After some time, the render nodes drop to around 4% processor usage and the frame average frame time rises from around 2 hours to more than 30 hours. When I check the nodes via Teamviewer, the 3dsMax process has set processor affinity to just one of 56 threads. As soon as the affinity is set to all cores, the CPU usage is 100% again and the frames render as expected.
During job assignment, the affinity is set to use all cores. It happens totally randomly, and most of the time the next frame is rendering at 100% all the time until the error occurs again.
Attached you will find a screenshots illustrating the problem. It shows the processor affinity for an affected node.
Hi @kossatz
Thank you very much for the report! Both Render Manager and our 3ds Max plugin can change the affinity automatically if they detect that 3ds Max is eating up too much resources during the rendering. They should set the affinity to all cores - 1 to keep the connection stable.
Could you please send us some collected log (https://scribehow.com/shared/How_to_collect_your_Render_Manager_logs__yJti4785TbSGGJqV6PgKhg) from a computer that produces this issue and we will make the required changed to avoid this problem.
As a workaround until then if you set all cores - 1 by default for the dual xeon nodes then it should be fine.
Well, after each start of the nodes, the affinity is automatically set to use all cores.
I can manually adjust the slider to use 47/48 cores for example, but after each restart, it will default to 48/48.
When the issue next occurs, I will try to generate the log files as described in the last post.
Regards
Oliver
The problem occurred again last night. After a certain amount of time, some of the render nodes have their processor affinity set to 1, leading to extremely high render times.
The collected log files were sent to support as described.
Hi there.
Did you solved the problem with processor affinity? I have the same problem.
Set processor affinity in pulze doesn’t work at all. I must open task manager, go in details tab and manually set affinity for all cores (its not checked by default, which is very strange). After that, rendering work fine until next stripe load. Then again, I must set affinity manually.
No, sadly not. The problem still persists on our end.
I did send the log files to support, but they did not get to it yet it seems.
But good to know there are other users out there affected by the same issue.
Hi @kossatz
Thanks for the bump. We did received your ticket and we replied that we are looking into the logs. I hope we can identify the problem soon and fix this issue.
The issue appeared again this weekend. The log files of the affected nodes was sent to support.
Regards
Oliver
The issue appeared again today, this time on a job with DR enabled. Log files of the affected nodes was sent to support.
Right now Render Manager is nearly unusable to us. And I deeply regret the decision to have bought this software.
The issue is still present on our render farm with the latest update 2.2.10. It happens daily. Right now I have to babysit every single job sent to Pulze, which is not what this software is intended for.
I have sent the logs to support.
Thank you @kossatz we will try to find a solution for your issue asap and will get back to you via email.
I’m also having the same issue, even with -1 affinity. Has there been a fix for this?